Financials
The Financials tab gives you a configurable view of customer costs, forecasts, budgets, service drivers, commitment coverage, tags, and selected cloud posture indicators.
Use it to answer questions such as:
- How much have we spent in the selected month?
- What is the projected month-end spend?
- How does the current period compare with the same period last month?
- Which accounts, services, and tags are driving cost?
- Are commitments covering enough eligible spend?
- Which views should the customer team monitor regularly?
Open Financials
- Open Factor Fifty.
- Select Financials in the customer navigation.
Factor Fifty opens the customer’s default dashboard. If no default is available, it opens the first dashboard.
Financial dashboards belong to the customer, not to an individual user. Changes to dashboards, widgets, filters, and widget order can affect what other users with access to that customer see.
Page layout
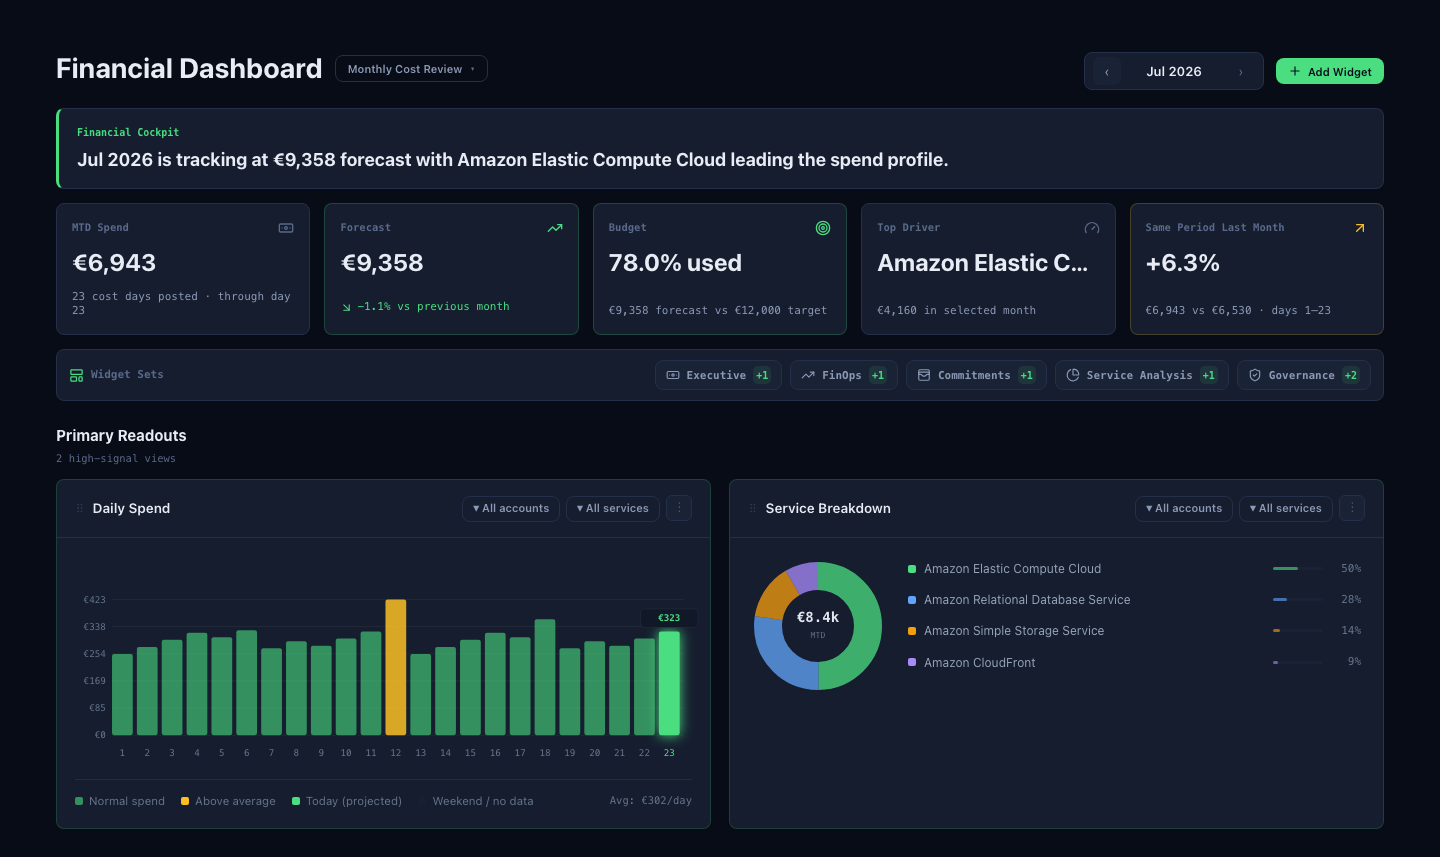
The Financials page contains four main areas:
- Dashboard and month controls — choose the dashboard and reporting month.
- Financial Cockpit — a fixed summary of the selected month.
- Widget Sets — quickly add a group of related widgets.
- Primary Readouts and Analysis Widgets — the configurable detail views.
The Financial Cockpit is always present. The widgets below it depend on how the selected dashboard has been configured.
Provider and currency scope
The current Financials page uses AWS as the provider scope for its standard account, service, security, and commitment widgets. It does not currently provide an AWS/Azure selector.
The Financial Cockpit uses the executive budget currency when a budget has been configured. Dashboard widgets use the customer project currency and fall back to USD when no currency is available. Keep these currency settings aligned when comparing values across the page.
Manage dashboards
Select the dashboard name beside Financial Dashboard to switch views or manage dashboards.
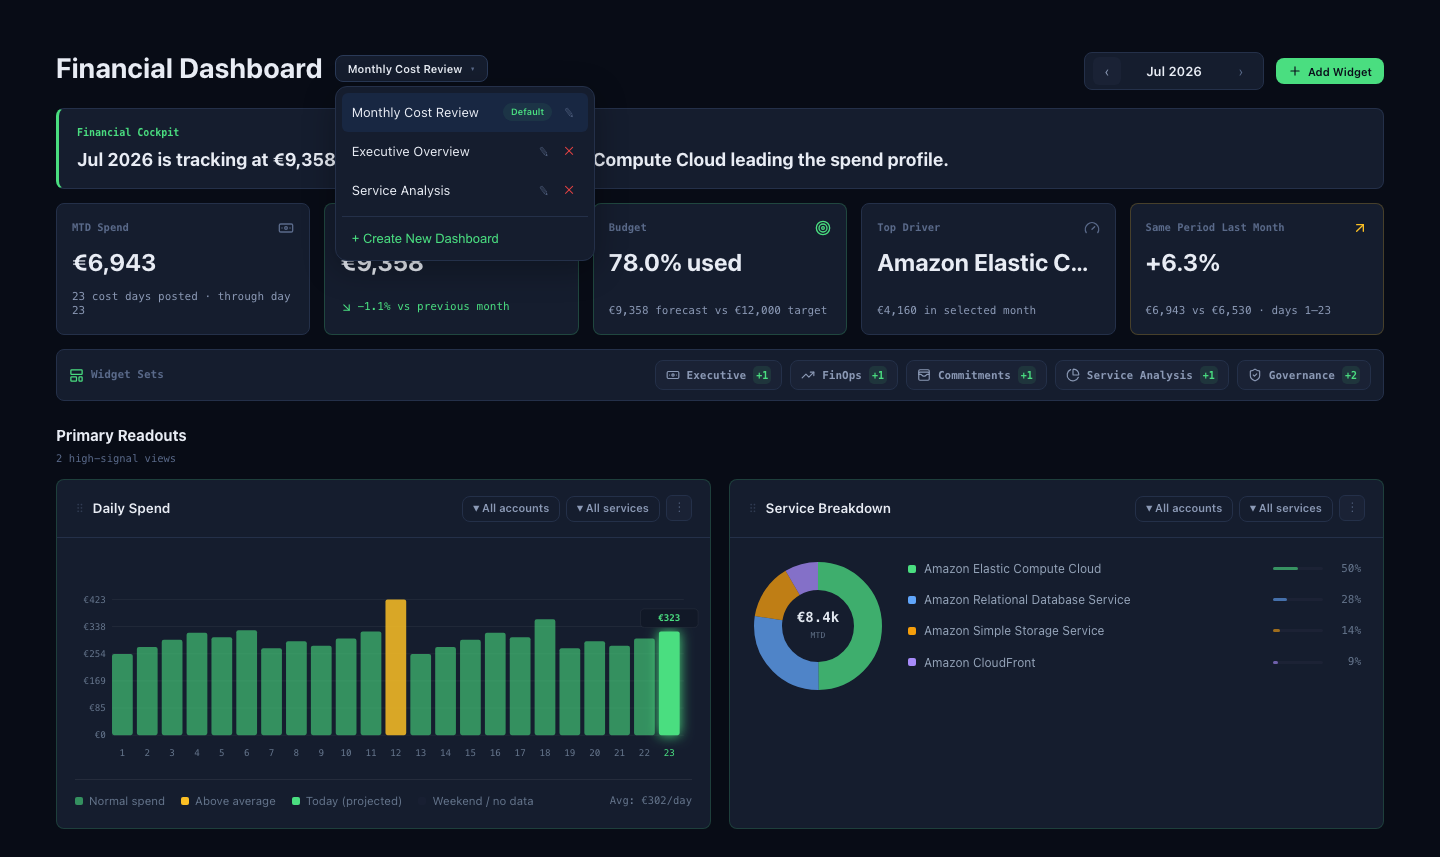
Create a dashboard
- Open the dashboard selector.
- Select Create New Dashboard.
- Enter a name of up to 100 characters.
- Select Create.
The first dashboard created for a customer becomes the default dashboard.
Rename a dashboard
Open the dashboard selector and select the pencil beside the dashboard name. Enter the new name and press Enter, or select elsewhere to save it.
Delete a dashboard
You can delete a non-default dashboard when at least one other dashboard exists.
Deleting a dashboard also deletes all of its widgets and cannot be undone. The default dashboard is protected from deletion in the Financials page.
Saved reporting month
Each dashboard remembers its selected reporting month. Switching dashboards can therefore also switch the month shown on the page.
Select a reporting month
Use the previous and next arrows in the upper-right corner to change the reporting month.
- You can review the current month or an earlier month.
- You cannot move into a future month.
- The selected month controls the Financial Cockpit and most cost and tag widgets.
Some widgets deliberately use a different period. See Data periods and freshness for the exceptions.
Financial Cockpit
The Financial Cockpit is a fixed summary above the configurable widgets. Its headline describes the selected month, available forecast, and leading service.
MTD Spend or Monthly Spend
For the current month, this card is labelled MTD Spend and totals the daily cost posted so far.
For a completed month, it is labelled Monthly Spend and shows the actual spend returned for that month.
The supporting text shows:
- how many distinct cost days have been posted;
- the latest day of the month included in the data.
Forecast or Actual Spend
For the current month, Factor Fifty calculates a run-rate forecast after at least 10 distinct cost days have been posted:
spend posted so far ÷ latest posted day × number of calendar days in the month
Before 10 cost days are available, the card shows that it is waiting for more data. If daily spend is unavailable, no forecast is calculated.
For a completed month, the card is labelled Actual Spend and uses the reported monthly amount instead of a forecast.
When available, the current-month forecast is also compared with the previous full month.
The forecast is a straight-line run-rate estimate. It does not account for planned deployments, seasonal usage, future commitments, or other expected changes.
Budget
The Budget card compares the forecast—or actual spend for a completed month—with the customer’s monthly executive budget.
The percentage means:
forecast or actual spend ÷ monthly budget
Its colour follows the warning and critical thresholds configured on the Executive Overview.
If no budget is configured, the card shows No target. If a forecast is still waiting for enough posted days, it shows Awaiting forecast.
Top Driver
Top Driver identifies the service with the highest total cost in the selected month and shows its reported spend.
Use a Service Breakdown or Top Services widget when you need to compare that service with the rest of the cost profile.
Same Period Last Month
This card compares like-for-like calendar days.
For example, if cost data is posted through day 18, Factor Fifty compares:
- the selected month from day 1 through day 18;
- the previous calendar month from day 1 through day 18.
The percentage is positive when current spend is higher and negative when it is lower. The supporting text shows both amounts and the matched day range.
If either period has no usable daily spend, the card shows No comparison.
Widget Sets
Widget Sets add related widgets in one action.
| Set | Widgets added |
|---|---|
| Executive | Monthly Spend, Service Breakdown, Commitment Coverage, and Top Services |
| FinOps | Daily Spend, Monthly Spend, Service Breakdown, and Account Distribution |
| Commitments | Commitment Coverage, Daily Spend, and Service Breakdown |
| Service Analysis | Service Breakdown, Top Services, and Storage Spend |
| Governance | Security Score and Findings by Pillar |
A set adds only widget types that are missing from the selected dashboard. It does not replace existing widgets or change their filters.
Once every widget in a set is present, that set is no longer shown.
Add an individual widget
Select Add Widget and use the category buttons or search box to find a widget.
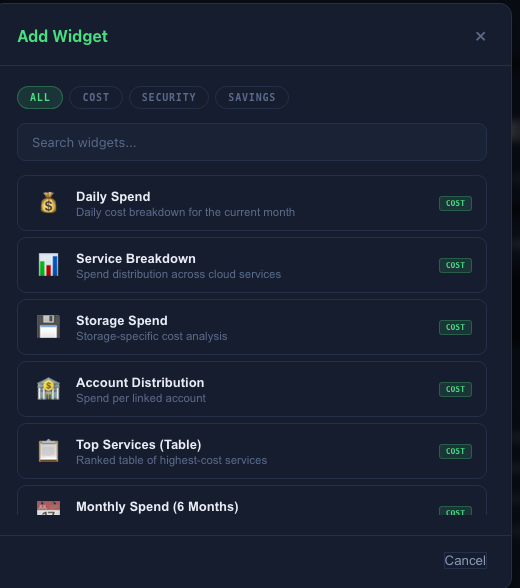
Cost widgets
| Widget | What it shows |
|---|---|
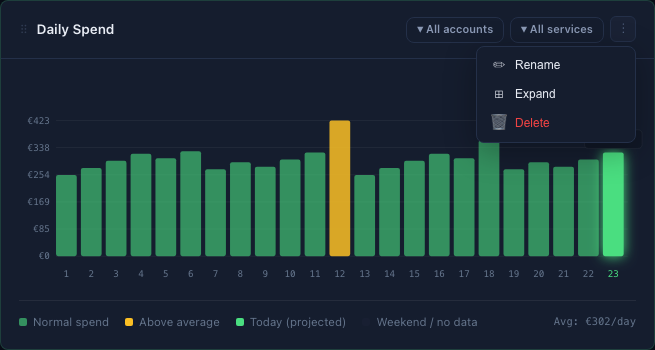
| Daily Spend | Daily spend for the selected month, including the average daily cost and visual markers for above-average days. |
| Service Breakdown | A donut chart of spend across the highest-cost services for the selected month. |
| Storage Spend | Storage-related spend grouped by service for the selected month. |
| Account Distribution | Spend split across the customer’s linked accounts for the selected month. |
| Top Services (Table) | Up to ten services ranked by spend, including each service’s reported cost and line-item count. |
| Monthly Spend (6 Months) | The latest six-month spend trend, with the current month highlighted. |
Security widgets
| Widget | What it shows |
|---|---|
| Security Score | Overall score, findings, pass rate, and the number of accounts in the latest AWS security scan. |
| Findings by Pillar | Failed findings grouped by Well-Architected pillar from the latest AWS security scan. |
Security widgets use the latest available scan rather than the month selected in Financials.
Savings widget
| Widget | What it shows |
|---|---|
| Commitment Coverage | The percentage of eligible spend covered by commitments versus spend that remains uncommitted. |
Commitment Coverage uses the current calendar month, even when you select an earlier reporting month.
Tag widgets
| Widget | What it shows |
|---|---|
| Tag Daily Spend | Daily spend in the selected month for the chosen tag scope. |
| Tag Spend Distribution | Spend distributed across tag values. |
| Top Tags (Table) | Up to 25 tag key/value combinations ranked by spend. |
| Tag Service Spend | Service spend for a selected tag key and optional tag value. A tag key is required. |
| Tag Account Split | Spend across accounts for a selected tag key and optional tag value. A tag key is required. |
Tag widgets hide untagged entries by default. Use the tagged/untagged control in the widget header to include them.
Filter a widget
Filters are applied per widget and saved with the dashboard.
Depending on the widget, the header can provide:
- Account filter — select one or more linked accounts. With nothing selected, the widget uses all available accounts.
- Service filter — select one or more cloud services. With nothing selected, the widget uses all services.
- Tag key — choose the tag dimension to analyse.
- Tag value — narrow the selected tag key to one value.
- Untagged control — include or exclude entries without the selected tag.
Only controls relevant to a widget’s data are shown. Filters on one widget do not change the Financial Cockpit or other widgets.
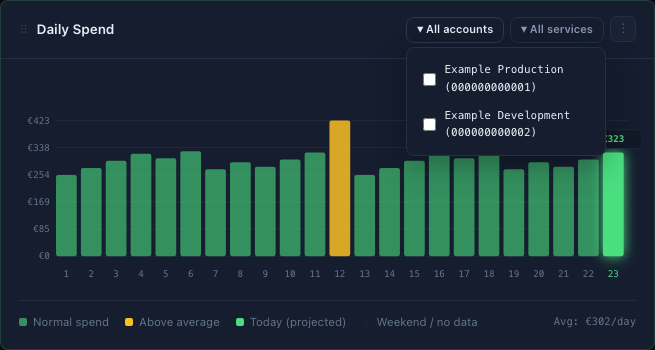
Arrange and manage widgets
Open the three-dot menu in a widget header to rename, expand, collapse, or delete the widget.
Reorder widgets
Drag a widget using the handle beside its title and drop it in the desired position.
The first two widgets in the saved order appear as larger Primary Readouts. All remaining widgets appear under Analysis Widgets.
Rename a widget
Double-click the widget title, or open the three-dot menu and select Rename. Press Enter or select elsewhere to save the new title.
Renaming changes only the title; it does not change the widget’s data or filters.
Expand or collapse a widget
Open the three-dot menu and select Expand to make the widget span the full dashboard width. Select Collapse to return it to the normal grid.
Delete a widget
Open the three-dot menu and select Delete.
Widget deletion takes effect immediately. Re-add the widget from Add Widget if it was removed accidentally; its previous title and filters are not restored.
Data periods and freshness
Not every Financials element follows the selected month.
| Information | Period used |
|---|---|
| Financial Cockpit | Selected month |
| Daily, service, storage, account, top-service, and tag widgets | Selected month |
| Monthly Spend widget | Latest six reported months |
| Security widgets | Latest available AWS security scan |
| Commitment Coverage | Current calendar month |
| Budget | Current customer-level executive budget target |
Cost and scan data can arrive after activity occurs in the cloud provider. The posted-day count, latest scan behaviour, and No data messages help identify when a source has not yet returned usable information.
Recommended review routine
For a monthly financial review:
- Select the dashboard intended for the review.
- Confirm the reporting month.
- Check the Financial Cockpit forecast, budget, top driver, and matched-period comparison.
- Use Daily Spend to identify unusual days.
- Use Service Breakdown, Top Services, and Account Distribution to locate the source of a change.
- Use tag widgets to connect spend to ownership, environment, application, or another tagging standard.
- Review Commitment Coverage before investigating commitment opportunities in Savings.
- Save a clear widget order so the most important two views remain under Primary Readouts.