Monitoring
The Monitoring tab brings cloud health events, general alerts, and URL checks into one customer-level queue.
Use it to answer:
- Is a cloud provider event affecting the customer now?
- Which general alerts are still firing?
- Are monitored endpoints available?
- What happened during the last 24 hours?
Open Monitoring
- Open Factor Fifty.
- Select Monitoring in the customer navigation.
- Choose a view in the left sidebar.
Monitoring views
| View | Purpose |
|---|---|
| AWS / Azure Health | Review provider health issues, planned changes, and resolved events. |
| General Monitoring | Review integrated operational incidents. This view is currently marked Beta. |
| URL Monitoring | Review endpoint availability, recent downtime, and check status. |
The badge beside a view shows the number of critical or degraded signals that currently need attention.
AWS / Azure Health
The default view presents health events from the connected cloud monitoring data.
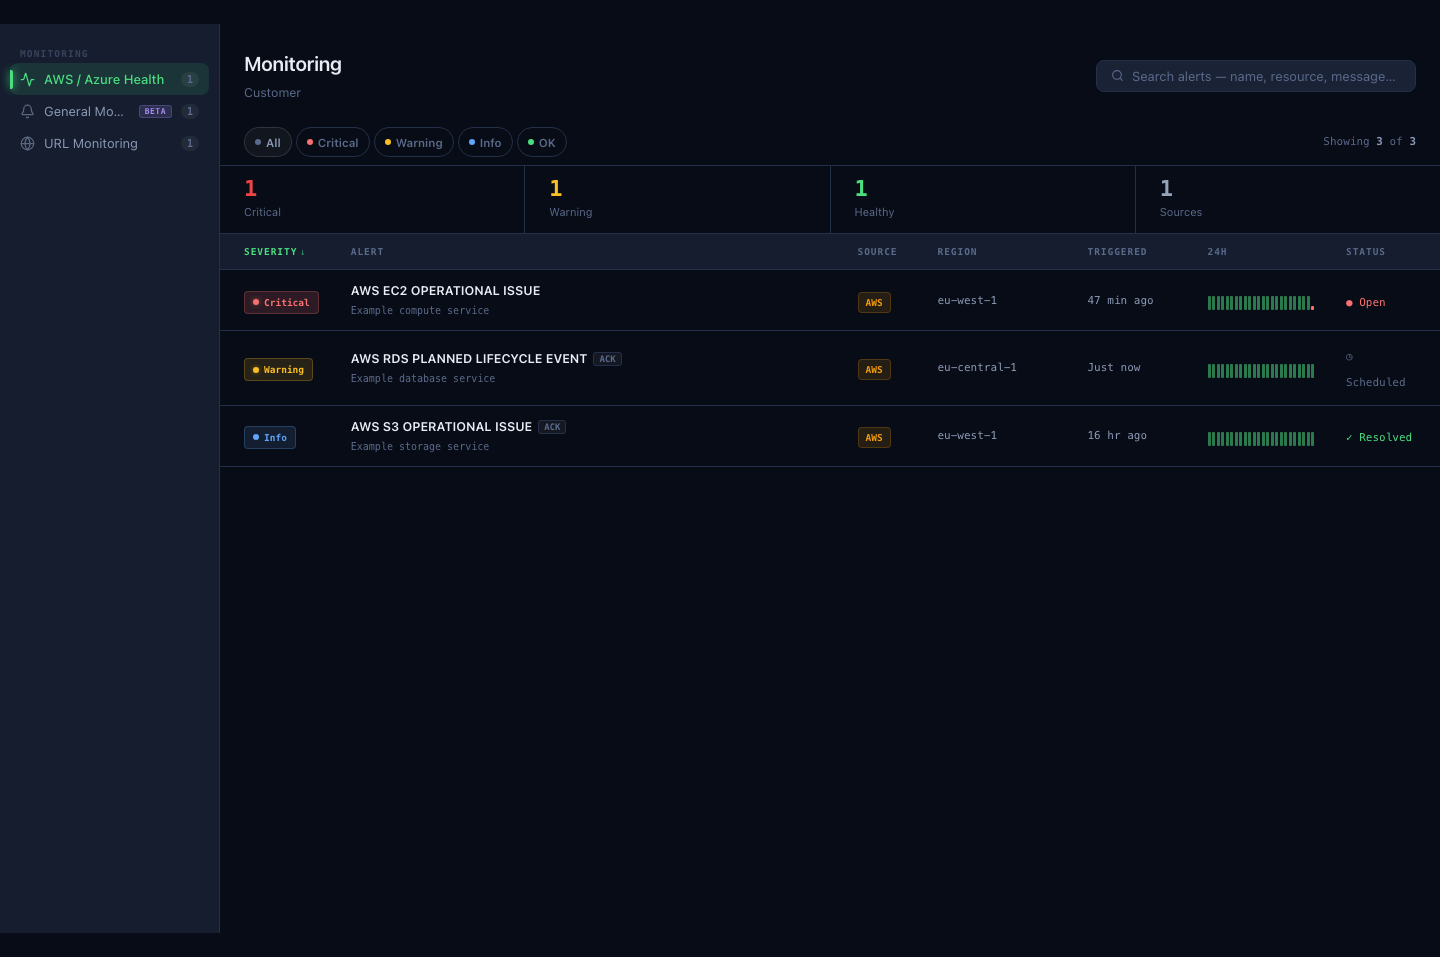
The summary row shows critical, warning, healthy, and source counts for the active view. The event table contains:
| Column | Meaning |
|---|---|
| Severity | Critical, warning, informational, or OK. |
| Alert | Event type and affected service or resource summary. |
| Source | The system or provider that supplied the event. |
| Region | Region associated with the signal, when available. |
| Triggered | Relative time since the event started. |
| 24h | Compact availability or event-state history for the last 24 hours. |
| Status | Open, scheduled, resolved, or healthy. |
Open provider issues appear as active alerts. Upcoming events appear as scheduled warnings. Closed events remain visible as resolved context.
General Monitoring
The General Monitoring view lists incidents from the configured alert integration. It can show priority, source, affected entity, acknowledgment state, and event history.
Because this view is marked Beta, confirm important incidents in the source monitoring or incident-management system before using them for escalation decisions.
URL Monitoring
The URL view groups endpoint checks by operational priority. A check can appear as:
| Status | Meaning |
|---|---|
| Critical / firing | The endpoint is currently reported as down. |
| Warning | Recent downtime or degraded aggregate uptime needs review. |
| Info / scheduled | The check is paused. |
| OK | The endpoint is up with no current degraded signal. |
The table shows the endpoint name, URL, priority, current state, and a 24-hour availability strip.
Filter, search, and sort
Use the severity pills above the table to show All, Critical, Warning, Info, or OK rows.
The search box matches alert name, resource, message, and source. Select a sortable column heading to change the ordering.
Filters apply only to the active Monitoring view.
Alert details
Select a table row to open the detail panel.
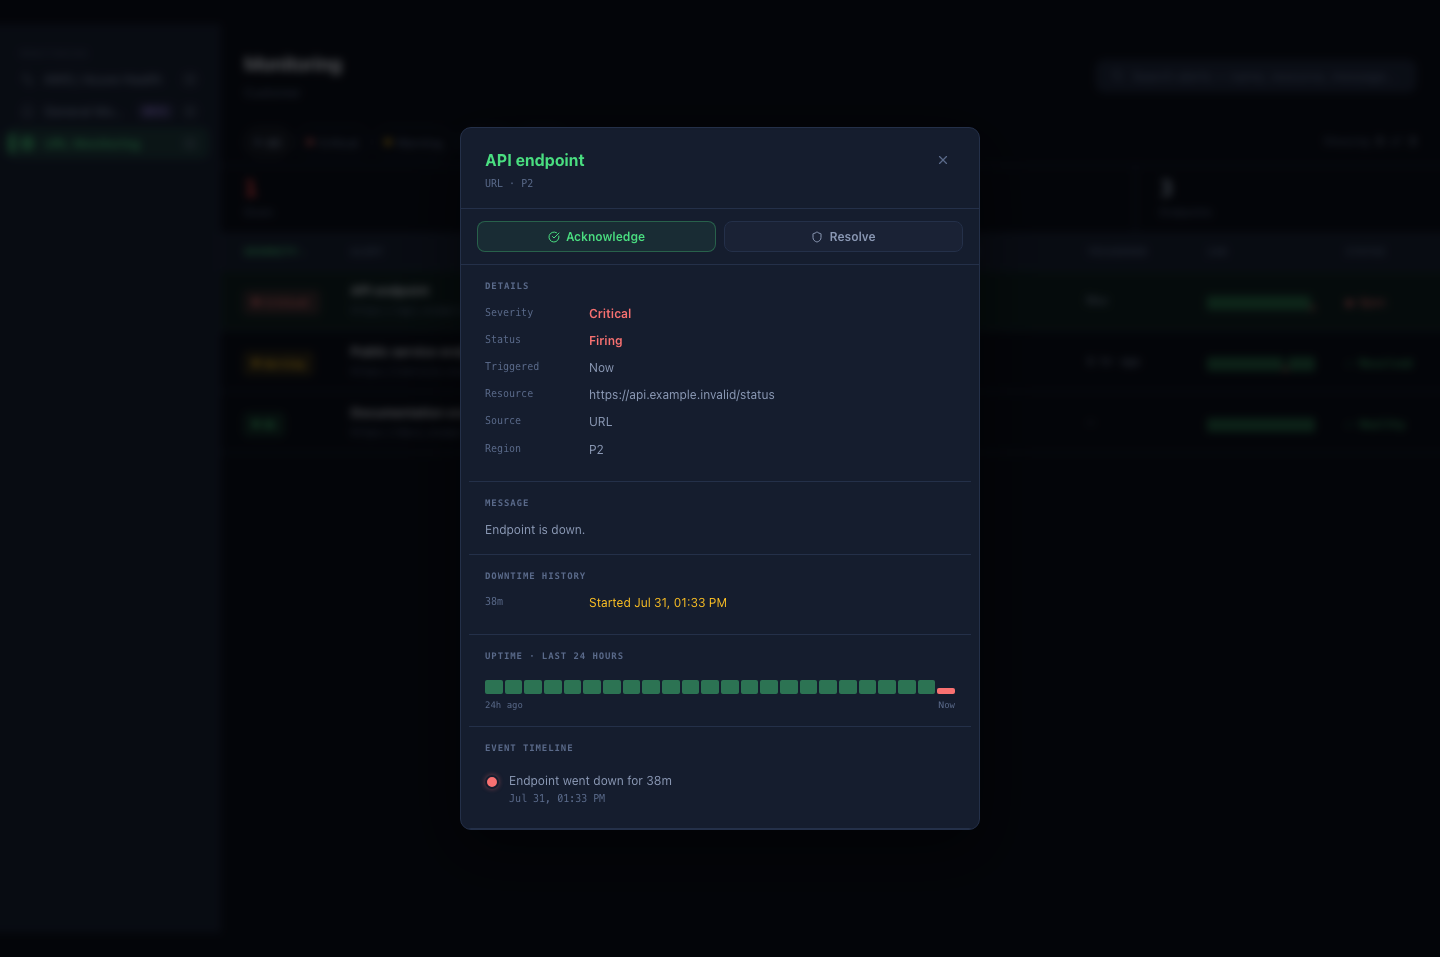
Depending on the signal, the panel can show:
- severity, status, source, region, and trigger time;
- affected resource or endpoint;
- the source message;
- downtime duration and history;
- the last 24 hours of availability;
- an event timeline;
- provider service, event category, incident priority, or check interval.
Acknowledge and resolve
For general and URL alerts, the detail panel provides Acknowledge and Resolve controls. These controls update the alert presentation in the current Monitoring page. Always confirm the persistent incident state in the connected source system when operational follow-up depends on it.
Cloud provider health events do not show these controls because their lifecycle comes from the provider source.
Data freshness
Monitoring data comes from multiple systems and can update at different times.
| Information | Freshness indicator |
|---|---|
| Cloud health | Relative trigger time and source status |
| General alerts | Created and updated timestamps from the alert integration |
| URL checks | Current check status, aggregate uptime, and availability history |
A resolved event can remain in the table to provide recent context. Refresh the page or verify the source system before declaring an incident closed.
Recommended review routine
- Start with AWS / Azure Health and review open critical signals.
- Check scheduled changes that overlap a planned release or maintenance window.
- Open General Monitoring and review unacknowledged high-priority alerts.
- Open URL Monitoring and investigate down or degraded endpoints.
- Select a row to review the source message and timeline.
- Confirm persistent state and ownership in the connected operational system.